 2:14
2:14
2023-12-08 13:55
 18:17
18:17
18:17
2024-11-07 22:39
 12:54
12:54
![Enrasta - Франция (Премьера клипа 2025)]() 2:44
2:44
![Ozoda - Chamadon (Official Video 2025)]() 5:23
5:23
![Леся Кир - Альфонс (Премьера клипа 2025)]() 3:23
3:23
![Бекзод Хаккиев - Айтаман (Премьера клипа 2025)]() 2:41
2:41
![Джатдай - Тобою пленен (Премьера клипа 2025)]() 1:59
1:59
![ARTEE - Ты моя (Премьера клипа 2025)]() 3:31
3:31
![Tural Everest, Руслан Добрый - Красивая (Премьера клипа 2025)]() 3:16
3:16
![Женя Белоусова - Раненая птица (Премьера клипа 2025)]() 2:47
2:47
![Аброр Киличов - Тим-Тим (Премьера клипа 2025)]() 4:42
4:42
![Zhamil Turan - Губки не целованы (Премьера клипа 2025)]() 2:37
2:37
![Бунёд Бобокулов - Отам-онам (Премьера клипа 2025)]() 4:00
4:00
![Шавкат Зулфикор & Нурзида Исаева - Одамнинг ёмони ёмон буларкан (Премьера клипа 2025)]() 8:21
8:21
![NAIMAN - Плакала (Премьера клипа 2025)]() 2:21
2:21
![Ахрор Гуломов - Ёмгирлар (Премьера клипа 2025)]() 3:49
3:49
![Карина Салагати - Сердце горца (Премьера клипа 2025)]() 3:18
3:18
![Эльдар Агачев - Путник (Премьера клипа 2025)]() 3:14
3:14
![Отабек Муминов - Кетябсан (Премьера клипа 2025)]() 3:17
3:17
![Рейсан Магомедкеримов - Моя мадам (Премьера клипа 2025)]() 3:28
3:28
![Соня Белькевич - Подогналась (Премьера клипа 2025)]() 3:13
3:13
![Ольга Стельмах – Не будем всё усложнять (Премьера клипа 2025)]() 4:01
4:01
![Гедда | Hedda (2025)]() 1:48:23
1:48:23
![Убойная суббота | Playdate (2025)]() 1:34:35
1:34:35
![Битва за битвой | One Battle After Another (2025)]() 2:41:45
2:41:45
![Школьный автобус | The Lost Bus (2025)]() 2:09:55
2:09:55
![Орудия | Weapons (2025)]() 2:08:34
2:08:34
![Большое смелое красивое путешествие | A Big Bold Beautiful Journey (2025)]() 1:49:20
1:49:20
![Девушка из каюты №10 | The Woman in Cabin 10 (2025)]() 1:35:11
1:35:11
![Диспетчер | Relay (2025)]() 1:51:56
1:51:56
![Кей-поп-охотницы на демонов | KPop Demon Hunters (2025)]() 1:39:41
1:39:41
![Большой куш / Спи#дили | Snatch (2000) (Гоблин)]() 1:42:50
1:42:50
![Стив | Steve (2025)]() 1:33:34
1:33:34
![Фантастическая четвёрка: Первые шаги | The Fantastic Four: First Steps (2025)]() 1:54:40
1:54:40
![Свинтусы | The Twits (2025)]() 1:42:50
1:42:50
![Бешеные псы | Reservoir Dogs (1991) (Гоблин)]() 1:39:10
1:39:10
![Большой Лебовски | The Big Lebowski (1998) (Гоблин)]() 1:56:59
1:56:59
![Заклятие 4: Последний обряд | The Conjuring: Last Rites (2025)]() 2:15:54
2:15:54
![Рука, качающая колыбель | The Hand That Rocks the Cradle (2025)]() 1:44:57
1:44:57
![Крысы: Ведьмачья история | The Rats: A Witcher Tale (2025)]() 1:23:01
1:23:01
![Вальсируя с Брандо | Waltzing with Brando (2024)]() 1:44:15
1:44:15
![Хищник | Predator (1987) (Гоблин)]() 1:46:40
1:46:40
![Псэмми. Пять детей и волшебство Сезон 1]() 12:17
12:17
![Пластилинки]() 25:31
25:31
![Котёнок Шмяк]() 11:04
11:04
![Чуч-Мяуч]() 7:04
7:04
![Шахерезада. Нерассказанные истории Сезон 1]() 23:53
23:53
![Зебра в клеточку]() 6:30
6:30
![Пакман в мире привидений]() 21:37
21:37
![Забавные медвежата]() 13:00
13:00
![Сборники «Простоквашино»]() 1:05:35
1:05:35
![Енотки]() 7:04
7:04
![Полли Покет Сезон 1]() 21:30
21:30
![Новое ПРОСТОКВАШИНО]() 6:30
6:30
![Люк - путешественник во времени]() 1:19:50
1:19:50
![Истории Баданаму Сезон 1]() 10:02
10:02
![Корги по имени Моко. Защитники планеты]() 4:33
4:33
![Оранжевая корова]() 6:30
6:30
![Кадеты Баданаму Сезон 1]() 11:50
11:50
![Сборники «Оранжевая корова»]() 1:05:15
1:05:15
![Неодети]() 11:27
11:27
![Сборники «Ну, погоди!»]() 1:10:01
1:10:01
12:54

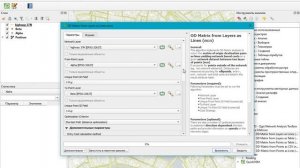
Скачать Видео с Рутуба / RuTube
| 230x144 | ||
| 384x240 | ||
| 576x360 | ||
| 768x480 | ||
| 1152x720 |
 2:44
2:44
2025-11-20 21:37
 5:23
5:23
2025-11-21 13:15
 3:23
3:23
2025-11-19 11:51
 2:41
2:41
2025-11-17 14:22
 1:59
1:59
2025-11-15 12:25
 3:31
3:31
2025-11-14 19:59
 3:16
3:16
2025-11-12 12:12
 2:47
2:47
2025-11-11 17:49
 4:42
4:42
2025-11-17 14:30
 2:37
2:37
2025-11-13 11:00
 4:00
4:00
2025-11-21 13:29
 8:21
8:21
2025-11-17 14:27
 2:21
2:21
2025-11-18 12:25
 3:49
3:49
2025-11-15 12:54
 3:18
3:18
2025-11-19 11:48
 3:14
3:14
2025-11-12 12:52
 3:17
3:17
2025-11-15 12:47
 3:28
3:28
2025-11-20 13:54
 3:13
3:13
2025-11-14 11:41
 4:01
4:01
2025-11-21 13:05
0/0
 1:48:23
2025-11-05 19:47
 1:34:35
2025-11-19 10:39
 2:41:45
2025-11-14 13:17
 2:09:55
2025-10-05 00:32
 2:08:34
2025-09-24 22:05
 1:49:20
2025-10-21 22:50
 1:35:11
2025-10-13 12:06
 1:51:56
2025-09-24 11:35
 1:39:41
2025-10-29 16:30
 1:42:50
2025-09-23 22:53
 1:33:34
2025-10-08 12:27
 1:54:40
2025-09-24 11:35
 1:42:50
2025-10-21 16:19
 1:39:10
2025-09-23 22:53
 1:56:59
2025-09-23 22:53
 2:15:54
2025-10-13 19:02
 1:44:57
2025-10-29 16:30
 1:23:01
2025-11-05 19:47
 1:44:15
2025-11-07 20:19
 1:46:40
2025-10-07 09:27
0/0
2021-09-22 22:23
 25:31
25:31
2022-04-01 14:30
 11:04
11:04
2023-05-18 16:41
 7:04
7:04
2022-03-29 15:20
2021-09-22 23:25
 6:30
6:30
2022-03-31 13:09
 21:37
21:37
2024-11-28 17:35
 13:00
13:00
2024-12-02 13:15
 1:05:35
2025-10-31 17:03
 7:04
7:04
2022-03-29 18:22
2021-09-22 23:09
 6:30
6:30
2018-04-03 10:35
 1:19:50
2024-12-17 16:00
2021-09-22 21:29
 4:33
4:33
2024-12-17 16:56
 6:30
6:30
2022-03-31 18:49
2021-09-22 21:17
 1:05:15
2025-09-30 13:45
 11:27
11:27
2025-10-10 18:25
 1:10:01
2025-07-25 20:16
0/0