
 7:02
7:02
2023-10-30 09:08
 2:41
2:41

 2:41
2:41
2023-12-21 22:39
 1:21
1:21

 1:21
1:21
2023-12-05 22:21
 4:57
4:57

 4:57
4:57
2023-12-05 20:15

 0:32
0:32

 0:32
0:32
2023-10-30 00:56
 3:20
3:20

 3:20
3:20
2023-12-22 01:07
 28:34
28:34

 28:34
28:34
2023-12-21 22:55

 0:58
0:58

 0:58
0:58
2023-10-30 01:05

 3:15
3:15

 3:15
3:15
2023-10-30 11:46
 1:07
1:07

 1:07
1:07
2023-12-21 21:50

 2:45
2:45

 2:45
2:45
2023-12-21 22:43
 4:30
4:30

 4:30
4:30
2023-07-31 11:25
 1:15
1:15

 1:15
1:15
2023-09-25 21:13
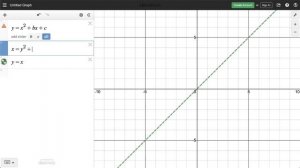
 1:00
1:00

 1:00
1:00
2023-09-15 16:46
 1:21
1:21

 1:21
1:21
2023-09-27 21:49
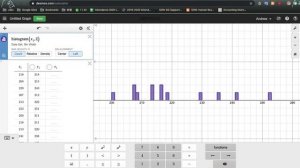
 2:30
2:30

 2:30
2:30
2023-09-21 20:56
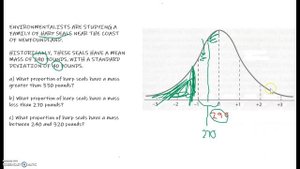
 4:17
4:17

 4:17
4:17
2023-09-11 22:26
 1:02
1:02
![Премьера клипа! Джиган и NILETTO, Loc-Dog - Дорого]() 2:41
2:41
![Премьера клипа! ANIVAR - ТАК И НЕ ПОНЯЛ]() 2:37
2:37
![Премьера клипа! Инна Вальтер - С козырей зашёл]() 3:31
3:31
![Премьера клипа! Bittuev и Брутто - Песня о грустном]() 2:49
2:49
![Премьера клипа! NEMIGA, NAVAI - Пойдем в кино]() 2:47
2:47
![Премьера клипа! Артур Бесаев - Просто знай]() 2:44
2:44
![Премьера клипа! Люся Чеботина - Каблук]() 3:15
3:15
![Премьера клипа! GAYAZOV$ BROTHER$ – Выбираю море]() 3:12
3:12
![Премьера клипа! BITTUEV - Лучшая черта]() 2:41
2:41
![Премьера клипа! ASAMMUELL - Продолжаем жить]() 2:57
2:57
![Премьера клипа! NECHAEV - Скучаю по тебе]() 2:49
2:49
![Премьера клипа! ДжаЯмми - Вива!]() 3:00
3:00
![Премьера клипа! AY YOLA - Ugez]() 3:53
3:53
![Премьера клипа! Ленинград - МУЗЫКАТАНЦА]() 2:46
2:46
![Премьера клипа! ANIVAR - ТАКСИ]() 3:02
3:02
![Премьера клипа! Мари aka Краймбрери — Интеллект]() 2:32
2:32
![Премьера клипа! ARTEE - А я так жду]() 3:23
3:23
![Премьера клипа! Артур Пирожков и Элвин Грей - Женщина-Магнит]() 3:13
3:13
![Премьера клипа! ХАБИБ - Шаганэ]() 2:49
2:49
![Премьера! 3-ий Январь и IL'GIZ - Дорога дальняя]() 2:44
2:44
![Стив | Steve (2025)]() 1:33:34
1:33:34
![Легенды: Гробница дракона (2013)]() 1:32:30
1:32:30
![Тот самый | Him (2025)]() 1:36:20
1:36:20
![Сирены (2025) Netflix]() 4:26:06
4:26:06
![Аббатство Даунтон 3 (2025)]() 2:03:57
2:03:57
![Первый день моей жизни]() 1:56:45
1:56:45
![Отец]() 1:32:56
1:32:56
![Стив (2025)]() 1:33:30
1:33:30
![Добыча (2022)]() 1:45:08
1:45:08
![Ниже нуля (2021) Netflix]() 1:46:35
1:46:35
![Токсичный мститель (2023)]() 1:42:11
1:42:11
![Пойман с поличным (2025)]() 1:46:41
1:46:41
![Плачущий убийца (1995)]() 1:41:57
1:41:57
![Девушка из каюты №10 (2025)]() 1:35:13
1:35:13
![не13]() 2:06:27
2:06:27
![Школьный автобус (2025)]() 2:09:51
2:09:51
![Хищник | Predator (1987) (Гоблин)]() 1:46:40
1:46:40
![Порочный круг (2025)]() 1:43:41
1:43:41
![Терминатор 2: Судный день | Terminator 2: Judgment Day (1991) (Гоблин)]() 2:36:13
2:36:13
![Хитмэн (2007) (Расширенная версия)]() 1:34:14
1:34:14
![Плохие парни: Очень плохой праздник (2023) / The Bad Guys: A Very Bad Holiday]()
 22:30
22:30
![Дорога домой (2021) / Back to the Outback]()
 1:31:40
![Альфа и Омега: Клыкастая братва (2010) / Alpha and Omega]()
 1:27:56
![Земля до начала времён 6: Тайна Скалы Динозавров (1998) / The Land Before Time VI]()
 1:12:60
![Земля до начала времён 13: Сила дружбы (2007) / The Land Before Time XIII]()
 1:15:39
![Земля до начала времён 3: В поисках воды (1995) / The Land Before Time III]()
 1:10:48
![Странные чары (2015) / Strange Magic]()
 1:39:20
![Шерлок Гномс (2018) / Sherlock Gnomes]()
 1:26:19
![Девочки из Эквестрии. Пропуск за кулисы для Сансет (2018) / Equestria Girls. Sunset's Backstage Pass]()
 44:08
44:08
![Эти прекрасные мультяшки: Рождественский выпуск (1992) / It's a Wonderful Christmas Special]()
 22:22
22:22
![Союз зверей (2010) / Animals United]()
 1:33:07
![Девочки из Эквестрии. Легенды вечнозелёного леса (2016) / Equestria Girls. Legend of Everfree]()
 1:13:14
![Смурфики (2011) / The Smurfs]()
 1:42:44
![Ночная жуть Тайни Тун (1995) / Tiny Toon Night Ghoulery]()
 43:38
43:38
![Земля до начала времён 12: Великий День птиц (2006) / The Land Before Time XII]()
 1:20:30
![Альфа и Омега 3: Большие Волчьи Игры (2013) / Alpha and Omega 3: The Great Wolf Games]()
 45:01
45:01
![Упс… Ной уплыл! (2015) / Ooops! Noah Is Gone...]()
 1:26:28
![Земля до начала времён 8: Великая стужа (2001) / The Land Before Time VIII]()
 1:15:49
![Альфа и Омега 5: Семейные каникулы (2014) / Alpha and Omega: Family Vacation]()
 43:30
43:30
![Плохие парни 2 (2025) / The Bad Guys 2]()
 1:43:47

 1:02
1:02Скачать видео
| 256x144 | ||
| 640x360 | ||
| 1280x720 | ||
| 1920x1080 |
 2:41
2:41
2025-08-22 19:10
 2:37
2:37
2025-09-07 15:55
2025-09-30 09:56
 2:49
2:49
2025-09-09 10:00
 2:47
2:47
2025-10-10 09:59
 2:44
2:44
2025-08-15 12:11
 3:15
3:15
2025-09-17 21:08
 3:12
3:12
2025-08-10 17:27
 2:41
2:41
2025-08-15 11:57
 2:57
2:57
2025-09-02 11:35
 2:49
2:49
2025-10-03 12:00
 3:00
3:00
2025-08-15 12:03
 3:53
3:53
2025-09-06 15:26
 2:46
2:46
2025-09-19 09:17
 3:02
3:02
2025-09-29 21:09
 2:32
2:32
2025-08-14 17:53
 3:23
3:23
2025-08-23 11:31
 3:13
3:13
2025-09-19 18:07
 2:49
2:49
2025-10-10 09:59
 2:44
2:44
2025-08-26 15:20
0/0
 1:33:34
2025-10-08 12:27
2025-10-10 08:28
 1:36:20
2025-10-09 20:02
 4:26:06
2025-10-12 20:27
 2:03:57
2025-10-05 21:44
 1:56:45
2025-10-13 11:38
 1:32:56
2025-10-13 11:37
 1:33:30
2025-10-05 21:21
 1:45:08
2025-10-06 12:51
 1:46:35
2025-10-14 21:34
 1:42:11
2025-10-14 21:50
 1:46:41
2025-10-04 09:54
 1:41:57
2025-10-15 14:06
 1:35:13
2025-10-12 11:54
2025-10-15 06:51
 2:09:51
2025-10-04 10:38
 1:46:40
2025-10-07 09:27
 1:43:41
2025-10-13 12:39
 2:36:13
2025-10-07 09:27
 1:34:14
2025-10-13 21:11
0/0

 22:30
22:30
2025-09-19 18:00

 1:31:40
2025-09-12 18:00

 1:27:56
2025-09-16 18:00

 1:12:60
2025-09-22 18:01

 1:15:39
2025-10-06 18:00

 1:10:48
2025-09-15 18:00

 1:39:20
2025-10-13 18:00

 1:26:19
2025-09-25 18:00

 44:08
44:08
Девочки из Эквестрии. Пропуск за кулисы для Сансет (2018) / Equestria Girls. Sunset's Backstage Pass
2025-10-03 18:00

 22:22
22:22
2025-09-11 18:00

 1:33:07
2025-10-15 18:01

 1:13:14
2025-10-01 18:00

 1:42:44
2025-09-27 18:00

 43:38
43:38
2025-09-09 18:00

 1:20:30
2025-10-04 18:00

 45:01
45:01
2025-10-10 18:00

 1:26:28
2025-09-06 18:00

 1:15:49
2025-09-26 18:00

 43:30
43:30
2025-10-14 18:00

 1:43:47
2025-09-23 18:00
0/0

